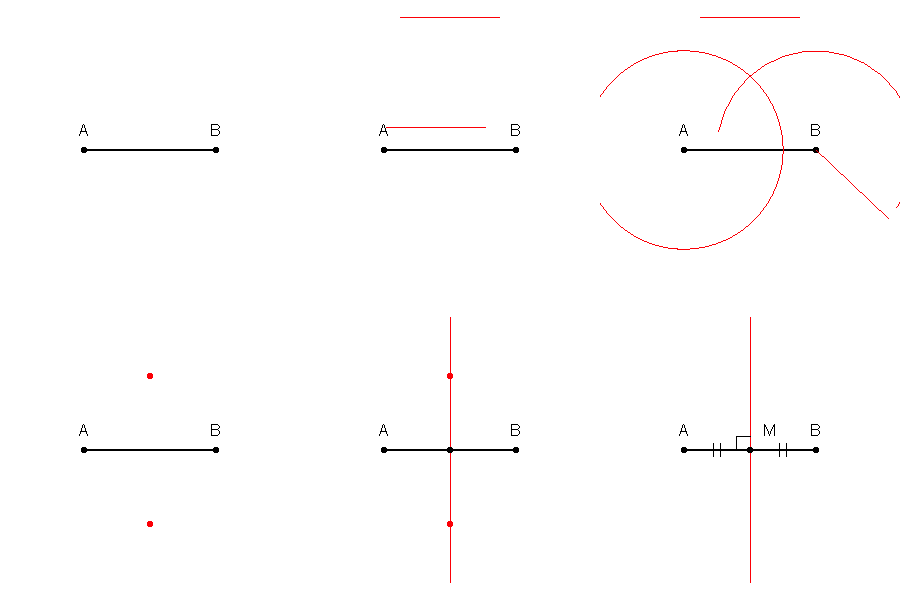
Qisqa izoh
Basic R code
png(file="img%05d.png", width=300, height=300, pointsize = 16)
plot.bk <- function(s){
	d1 <<- 1
	d2 <<- 1.5
	My <<- sqrt(d2^2 - d1)
	pause <<- 1L:30L
	angL <<- 30
	ang <<- seq(0,2*pi, length=angL)
	x1 <<- cos(ang)*d2 - d1
	x2 <<- cos(ang+pi)*d2 + d1
	y <<- sin(ang)*d2
	arc <<- seq(0, 2*pi, length=angL*10)
	xarc1 <<- cos(arc)*d2 - d1
	xarc2 <<- cos(arc+pi)*d2 + d1
	yarc <<- sin(arc)*d2

	par(mar=c(0,0,0,0))
	plot(NULL, xlim=c(-2.1,2.1), ylim=c(-2.1,2.1), type="n", xaxt="n", yaxt="n", asp=1, frame.plot=F)
	lines(c(-1*d1,d1), c(0,0), lwd=2)
	points(c(-d1,d1), c(0,0), pch=20)
	text(-1,0.3,"A")
	text( 1,0.3,"B")
	if(s == 1) {return()}

	lines(c(-1*d2/2,d2/2), c(2,2), lwd=1, col=2)
	if(s == 2) {return()}

	# lines(c(-1,x1[length(x1)]), c(0,y[length(y)]), lwd=1, col=2)
	lines(xarc1[1:length(xarc1)], yarc[1:length(yarc)], col=2)
	if(s == 3) {return()}

	# lines(c( 1,x2[length(x2)]), c(0,y[length(y)]), lwd=1, col=2)
	lines(xarc2[1:length(xarc1)], yarc[1:length(yarc)], col=2)
	if(s == 4) {return()}

	points(c(0,0), c(My,-1*My), pch=20, col=2)
	if(s == 5) {return()}

}

for(i in pause){plot.bk(1)}
for(i in pause){plot.bk(2)}
lp.x <- seq(-1*d2/2,-1*d1,length=length(pause))
lp.y <- seq(2,0,length=length(pause))
for(i in pause){
	plot.bk(2)
	lines(c(lp.x[i], lp.x[i]+d2), c(lp.y[i], lp.y[i]), col=2)
}

# 左紅一圓
for(i in 1:angL){
	plot.bk(2)
	lines(c(-1*d1,x1[i]), c(0,y[i]), lwd=1, col=2)
	lines(xarc1[1:(i-1)*10], yarc[1:(i-1)*10], col=2)
}

lp.x <- seq(-1*d2/2,d1-d2,length=length(pause))
lp.y <- seq(2,0,length=length(pause))
for(i in pause){
	plot.bk(3)
	lines(c(lp.x[i], lp.x[i]+d2), c(lp.y[i], lp.y[i]), col=2)
}

for(i in 1:angL){
	plot.bk(3)
	lines(c( d1,x2[i]), c(0,y[i]), lwd=1, col=2)
	lines(xarc2[1:(i-1)*10], yarc[1:(i-1)*10], col=2)
}

for(j in pause){plot.bk(4)}
for(j in pause){plot.bk(5)}
for(j in pause){
	plot.bk(1)
	points(c(0,0), c(My,-1*My), pch=20, col=2)
}
Myy <- seq(2, -2, length=length(pause))
for(j in pause){
	plot.bk(1)
	points(c(0,0), c(My,-1*My), pch=20, col=2)
	lines(c(0,0), c(Myy[1], Myy[j]), col=2)
}

for(j in pause){
	plot.bk(1)
	points(c(0,0), c(My,-1*My), pch=20, col=2)
	lines(c(0,0), c(Myy[1], Myy[length(Myy)]), col=2)
}

for(j in pause){
	plot.bk(1)
	points(c(0,0), c(My,-1*My), pch=20, col=2)
	lines(c(0,0), c(Myy[1], Myy[length(Myy)]), col=2)
	points(0,0,pch=20, col=1)
}

for(j in rep(pause, 2)){
	plot.bk(1)
	lines(c(0,0), c(Myy[1], Myy[length(Myy)]), col=2)
	text(0.3,0.3, "M", col=1)
	points(0,0,pch=20, col=1)
	lines(c(-0.45,-0.45), c(0.1,-0.1))
	lines(c(-0.55,-0.55), c(0.1,-0.1))
	lines(c(0.45, 0.45), c(0.1,-0.1))
	lines(c(0.55, 0.55), c(0.1,-0.1))
	lines(c(0,-0.2), c(0.2,0.2))
	lines(c(-0.2,-0.2), c(0.2,0))
}

dev.off()
Litsenziyalash
I, the copyright holder of this work, hereby publish it under the following license:
This file is made available under the Creative Commons CC0 1.0 Universal Public Domain Dedication .
The person who associated a work with this deed has dedicated the work to the public domain by waiving all of their rights to the work worldwide under copyright law, including all related and neighboring rights, to the extent allowed by law. You can copy, modify, distribute and perform the work, even for commercial purposes, all without asking permission.
http://creativecommons.org/publicdomain/zero/1.0/deed.en CC0 Creative Commons Zero, Public Domain Dedication false false
oʻzbekcha / ўзбекча Add a one-line explanation of what this file represents

