Phanerozoic_Sea_Level.png (523 × 360 piksel, fayl hajmi: 23 KB, MIME tipi: image/png)

Ushbu fayl Vikiomborga yuklangan boʻlib, boshqa loyihalarda ham qoʻllanilishi mumkin. Uning tavsif sahifasidan olingan maʼlumot quyida keltirilgan.

File:Phanerozoic Sea Level.svg is a vector version of this file. It should be used in place of this PNG file when not inferior.

File:Phanerozoic Sea Level.png → File:Phanerozoic Sea Level.svg

For more information, see Help:SVG.

In other languages
Alemannisch  العربية  беларуская (тарашкевіца)  български  বাংলা  català  нохчийн  čeština  dansk  Deutsch  Ελληνικά  English  British English  Esperanto  español  eesti  euskara  فارسی  suomi  français  Frysk  galego  Alemannisch  עברית  hrvatski  magyar  հայերեն  Bahasa Indonesia  Ido  italiano  日本語  ქართული  한국어  lietuvių  македонски  മലയാളം  Bahasa Melayu  norsk bokmål  Plattdüütsch  Nederlands  norsk nynorsk  norsk  occitan  polski  português  português do Brasil  română  русский  sicilianu  Scots  slovenčina  slovenščina  српски / srpski  svenska  தமிழ்  ไทย  Türkçe  татарча / tatarça  українська  vèneto  Tiếng Việt  中文  中文(中国大陆)  中文(简体)  中文(繁體)  中文(马来西亚)  中文(新加坡)  中文(臺灣)  +/−
New SVG image

Qisqa izoh

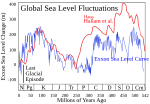
This figure compares the Hallam et al. (1983) and Exxon eustatic (global) sea level reconstructions for the Phanerozoic eon. The Exxon curve [1] is a composite from several reconstructions published by the Exxon corporation (Haq et al. 1987, Ross & Ross 1987, Ross & Ross 1988). Both curves are adjusted to the 2004 ICS geologic timescale.

Hallam et al. and Exxon use very different techniques of measuring global sea level changes. Hallam's approach is qualitative and relies on regional scale observations from exposed geologic sections and estimates of the areas of flooded continental interiors. Exxon's approach relies on the interpretation of seismic profiles to determine the extent of coastal onlap in subsequently buried sedimentary basins. Hallam is insensitive to rapid fluctuations in sea level. Exxon is sensitive to rapid fluctuations but tends to overinterpret local geologic changes resulting in bias towards reporting unphysical rapid fluctuations.

The depth scale is as reported by Exxon. Because Hallam is reported as qualtitative (i.e. uncalibrated), these sea level changes were scaled to match the Exxon record during the period 0–250 Myr.

A black bar is added to indicate the scale of sea level fluctuations during the last glacial/interglacial transition. This change occurred purely within the last 20 kyrs, and note that neither system of measurements is capable of resolving changes on this time scale. It also should be noted that very rapid fluctuations of similar scale are potentially possible during all periods during which large scale ice sheets are present (see: Phanerozoic climate change).

On the scale of this figure, the melting of all existing ice sheets would result in a sea level rise of ~80 meters. Changes on larger scales, which evidently occurred many times in the past, are the result of geologic changes in the structure of ocean basins. Essentially, such changes affect the average depth of the oceans relative to the continents.

Common symbols for geologic periods appear at the bottom.

This figure was prepared by Robert A. Rohde from publicly available data and is incorporated into the Global Warming Art project.

Image from Global Warming Art
This image is an original work created for Global Warming Art. Please refer to the image description page for more information.
GNU head Ushbu hujjatdan nusxa ko‘chirish, tarqatish va/yoki o‘zgartirish uchun GNU Erkin guvohnoma litsenziyasi (GNU Free Documentation License), 1.2 va har qanday keyingi versiyalar shartlariga muvofiq ruxsat berilgan yoki Ochiq kodli dasturlar jamiyati (Free Software Foundation) tomonidan chop etilgan; oʻzgarmas boʻlimlarsiz, oldingi muqova matnlari va orqa muqova matnlarisiz. Litsenziya nusxasi GNU Erkin guvohnoma litsenziyasi (GNU Free Documentation License) boʻlimiga kiritilgan.
w:en:Creative Commons
atribut bir xil ulashish
Bu fayl Creative Commons asosida litsenziyalangan Attribution- Share Alike 3.0 Unported litsenziyasi.
Siz erkinsiz:
  • ulashishga – ishlanmani nusxalash, tarqatish va uzatish
  • remiks qilishga – ishni moslashtirishga
Quyidagi shartlar asosida:
  • atribut – Siz tegishli litsenziyaga havolani taqdim etishingiz va oʻzgartirishlar kiritilganligini koʻrsatishingiz kerak. Siz buni har qanday oqilona yoʻl bilan qilishingiz mumkin, lekin litsenziar Sizni yoki Sizning foydalanishingizni ma'qullashini taklif qiladigan tarzda emas.
  • bir xil ulashish – Agar Siz materialni remiks qilsangiz, oʻzgartirsangiz yoki unga asoslansangiz, oʻz hissalaringizni asl nusxadagi kabi bir xil yoki mos litsenziya ostida tarqatishingiz kerak.
This licensing tag was added to this file as part of the GFDL licensing update.


References

  • Hallam, A., Phil. Trans. Royal Soc. B 325, 437-455 (1989).
  • Harland, W.B. and many others, A Geologic Time Scale, (1982).
  • Haq, B., J. Hardenbol, P. Vail., Science, 235, 1156-1167 (1987).
  • Ross, C.A. & J.R.P. Ross, Cushman Foundation for Foraminiferal Research Spec. Publ. 24, 137-149 (1987).
  • Ross, C.A. & J.R.P. Ross in Sea-level Change: an Integrated Approach (Eds. Wilgus, C.K., Hastings, B.J., Posamentier, H., van Wagoner, J.C., Ross, C.A., and Kendall, C.G. St. C.), SEPM Spec. Pub. 42:71-108 (1988).

Notes

  • Because Exxon traditionally used an in-house (i.e. unpublished) system for estimating the geologic age of stratigraphic sections it is not possible to perform an exact recalibration of the time scale. Instead it was adjusted assuming the Harland et al. 1982 time scale was a reasonable approximation.

derivative works

Derivative works of this file:

Captions

Add a one-line explanation of what this file represents

Items portrayed in this file

tasvirlangan obyekt

image/png

Fayl tarixi

Faylning biror paytdagi holatini koʻrish uchun tegishli sana/vaqtga bosingiz.

Sana/VaqtMiniaturaOʻlchamlariFoydalanuvchiIzoh
joriy02:24, 2005-yil 27-dekabr02:24, 2005-yil 27-dekabr dagi versiya uchun tasvir523 × 360 (23 KB)AngrenseVariation of the sea level during the Phanerozoic eon. Source:English versin of Wikipedia.

Bu faylga quyidagi 2 sahifalar bogʻlangan:

Faylning global foydalanilishi

Ushbu fayl quyidagi vikilarda ishlatilyapti:

Ushbu faylni koʻproq global foydalanishdan koʻring.